ScrollStats
Welcome to the ScrollStats documentation.
ScrollStats is an open-source Python tool to quantify the morphology of scroll bars preserved in the ridge and swale topography found in the floodplains of meandering rivers.
This quantification is accomplished by first generating a series of migration pathways, based on the geometric methods described by Hickin 1974, that trace channel migration across a river bend based on the orientation of preserved ridges in the floodplain.
These migration pathways are then used to sample a DEM and other derived topographic raster data to create a series of 1 dimensional signals from which the ridge morphometrics of amplitude, width, and spacing can be calculated for every intersection of a ridge and migration pathway.
The intersections of ridge and migration pathway form a geomorphically relevant grid across which these metrics can be aggregated and analyzed longitudinally or laterally relative to the channel.
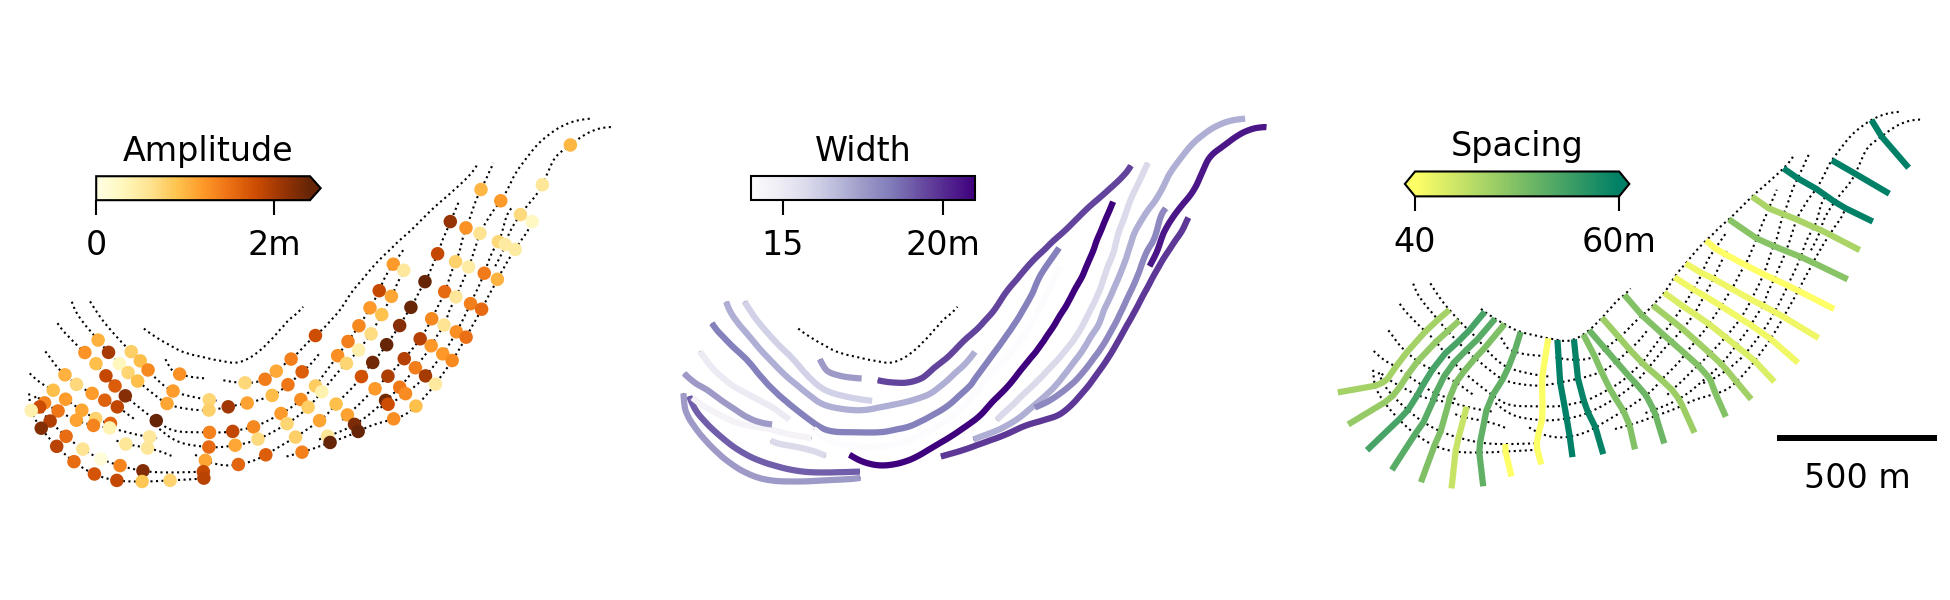
Figure 1: Measures of ridge amplitude (orange), width (purple), and spacing (green) are shown at the intersection, ridge, and migration pathway scales. Aggregate values represent the median value of each measurement taken at a ridge or migration pathway
Getting Started
If you intend to use ScrollStats for your own analysis, follow the User Installation instructions.
If you intend to develop or contribute to ScrollStats, follow the Developer Installation instructions.
User Installation
Install ScrollStats with pip
python -m pip install scrollstats
Or install with conda
conda install scrollstats
NOTE: scrollstats v0.1.3 must be installed with python <=3.12 when using conda
Developer Installation
First, clone the repo locally, create a virtual environment for the project,
then install the [dev] optional dependencies listed in pyproject.toml.
git clone https://github.com/tamu-edu/scrollstats

python -m venv venv/
source venv/bin/activate

(venv) python -m pip install -e ".[dev]"
The ScrollStats Workflow
The ScrollStats Workflow can be broken up into the 3 major steps listed below. Each of these steps is covered in detail in Example Workflow docs (linked below and in table of contents) with code examples using datasets generated from a bend on the Lower Brazos River, TX.
1. Delineate Ridge Areas
Delineate ridge areas from a DEM to create the ridge area raster. This is achieved by:
applying the profile curvature and residual topography transforms to the DEM
applying a threshold at 0 to these transformed rasters to create binary rasters
finding the union of these binary rasters
denoising the union raster
2. Create Vector Datasets
Create the following vector datasets to define key morphological features of the bend.
bend boundary
packet boundaries
channel centerline
ridge lines
migration pathways
Some of these datasets are digitized manually, while others are generated by ScrollStats. Details of the vector data creation process can be found in the doc linked above.
3. Calculate Ridge Metrics
Once all of the vector datasets are created and the raster areas are delineated, you can now calculate ridge metrics across the entire bend.
These metrics include ridge amplitude, width, and migration distance for every intersection of a ridge and migration pathway.